
Category: Investing & Trading
QQQs have moved up. Stock Market rally continues
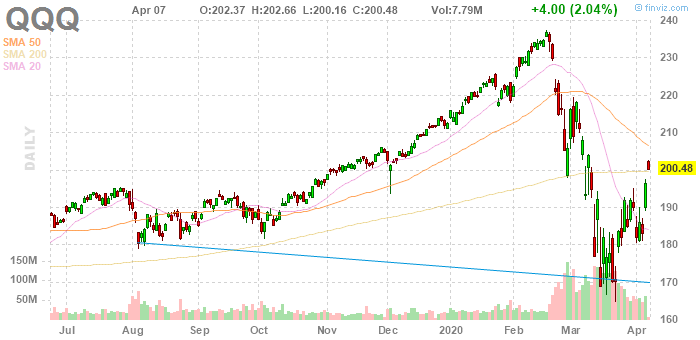
The stock chart of the QQQ is courtesy of finviz.com.
Note that the price move up above the 200 Day Moving Average. Note also, that the 20 day MA seems to have bottomed and looks to be starting to curl back up. When the price sits between the 200 Day MA and the 50 Day MA it could break up above the 50 Day MA. I suspect that the price will now sit between the 50 Day MA and the 200 Day MA
The rise IMHO is not the result of non professional stock traders. It takes deep pockets to move the market so rapidly. Note also that a ” W” shape has formed which IMHO is a bullish sign. All this points to a market bottom having been established??? If so I’m surprised and shocked at this turn around.
One idea that has crossed my mind is that if the stock markets stay down then the sitting US president will likely not get re-elected. That would mean the potential for future taxes on the wealthy instead of further Tax Breaks. If the US Stock Market goes back near or above the prior Highs, then the sitting president will very likely get re-elected. Those who can protect themselves, will. It is just strange to see this, as this is vastly different stock market behaviour say compared to 2007 and 2008. Back then the rally back up started around 2009.
I got interested in the QQQ ETF because there are Options available. With one low cost option, I can control 100 shares of the QQQ. I caught the drop around Apr 01 via a QQQ PUT Option trade.
| DATE | TRADE TYPE | SYMBOL | QUANTITY | TARGET PRICE | PRICE | COMMISSION | TOTAL CASH VALUE | |
|---|---|---|---|---|---|---|---|---|
| 4/2/2020 9:57 AM | Option: Sell to Close at Market Open | QQQ2003P190 (QQQ 190 – Fri 2020) | 10 | $7.92 | $19.50 | $7,900.50 | ||
| 4/1/2020 10:00 AM | Option: Buy to Open at Market | QQQ2003P190 (QQQ 190 – Fri 2020) | 10 | $6.46 | $19.50 | $6,479.50 |
I have not played the rally but I hope that this rally back up continues…
This post is for my educational purposes. Please seek out the advice of your own professional Investment Advisor before placing any bets at the Stock Market Casinos. You can lose money playing the Stock Market, even all of it.
Order filled for 10,000 shares of RIG on the NYSE at $7.60 per share
Buy order for 10,000 shares of RIG (Transocean Ltd) on the NYSE was filled at $7.60 per share.
Disclaimer: This post is not meant as Investment Advice, nor is it advice to buy or sell any shares in any company.. Do your own Due Diligence. Seek out the advice of your own financial and investment advisors before risking any funds in the Stock or Futures Markets. You can lose money and even all of it when investing at the Stock Market Casinos. This post is for my own educational purposes.
Posted by Vincent Banial
Buying 10,000 shares of RIG (Transocean Ltd) on NYSE on May 03 at Open at Market
A new Technical Trade. I’m stepping back from the Morning Gap trades and going beack to Technical Trades. Tomorrow I will buy 10,000 shares of RIG (Transocean Ltd) on the NYSE at Open at Market on May 03. All my trades are “all or none”.
I don’t think a Million share buy would get filled. also if the stock price is cheap – ie under say $10 per share then I’m sticking to either buys of 1,000 or 10,000 shares. Large volume buys help grow capital Gains but are frustrating because they it is hard to get filled. Then if I want to dump, it could backfire on me as getting fills could be an issue. 1 K or 10K should be fine.

Stock chart of RIG (Transocean Ltd) on NYSE. Chart courtesy of www.tradingview.com Buy was triggered by CCI and Woodies CCI and confirmed by RSI. On Aug 21 2017 the stock bottomed at this same level. Normally the price has been above the current price range. Hence I am of the opinion that the price has again bottomed and it is time to buy. This is longer term hold (might be a swing trade or longer – it is not quick flip type of trade).
Disclaimer: This post is not meant as Investment Advice, nor is it advice to buy or sell any shares in any company.. Do your own Due Diligence. Seek out the advice of your own financial and investment advisors before risking any funds in the Stock or Futures Markets. You can lose money and even all of it when investing at the Stock Market Casinos. This post is for my own educational purposes.
\
Posted by: Vincent Banial
Buy order filled – 10,000 Shares of ECA Encana Corp on NYSE at $6.44 ea
Order filled at 9.31am on NYSE. Bought 10,000 shares of ECA Enacna Corp today at $6,44 per share.
Posted by: Vincent Banial
Buying 10,000 shares of ECA (Encana Corp) on the NYSE tomorrow May 02 at Open at Market
Another Technical trade, based on CCI and confirmed by RSI. Because the price of this stock is under $10, I cannot buy 1 Million Shares. Even an order for 100,000 shares would have some issues. 10K should get filled quickly and easily. I believe that I am a bit early on the buy, as Friday morning might confirm what I expect will happen. I had waited too long to get into the PINS IPO as I did not expect the share price keep rising day after day without any consolidation (at least not till I bought in).
Buying 10,000 shares of ECA (Encana Corp) trading on the NYSE at Open on May 02 at Market.
https://stockcharts.com/freecharts/gallery.html?ECA
My Target to sell will be around $8.35 as Resistance is around $8.50. The Gap Down which was created Nov 01 2018 could get filled and the price could float higher around $10 before taking a longer rest.
Disclaimer: This post is not meant as Investment Advice. Do your own Due Diligence. Seek out the advice of your own financial and Investment Advisors before risking any funds in the Stock or Futures Markets. You can lose money and possibly all of it. This post is for my own educational purposes.
Posted By Vincent Banial
Order Fills
TWTR – 1,000,000 shares at $39.30 per share – filled
AAN – 1,000 shares at $58.00 per share – filled
MTP – 1,000,000 shares at $3.60 per share – filled
PINS – 1,000,000 shares at $34.81 per share – filled
NVDA – 10,000 shares at $178.75 per share – filled
MTP is a foreign BioTech – an ADR – long term this should work out. Short Term loser – went below $2.00 today. Will hold for long term.
Interesting the difference between low price and high priced share performance coming off a Breakout Gap (except PINS which is a IPO and NVDA which was based on the CCI and Woddies CCI).
Disclaimer: This post is not meant as Investment Advice, nor is it advice to buy or sell any shares in any company. Do your own Due Diligence. Seek out the advice of your own financial and investment advisors before risking any funds in the Stock or Futures Markets. You can lose money and even all of it when investing at the Stock Market Casinos. This post is for my own educational purposes.
Posted by Vincent Banial
Buy order for 10,000 shares of NVDA filled at $178.75 per share Apr 30
Buy order for 10,000 shares of NVDA NVIDIA Corporation on Nasdaq filled at $178.75 per share Apr 30.
Post by Vincent Banial
PINS filled @ $34.81. Unable to buy AIRI – no volume. AIRI order canceled
PINS filled @ $34.81. Unable to buy AIRI – no volume. AIRI order canceled.
Posted by Vincent Banial
Buying 10,000 shares of AIRI ( Air Industries Group) on AMEX at market Open Apr 30
Buying 10,000 shares of AIRI ( Air Industries Group) on AMEX today (Apr 30) at Market Open with an at Market Buy order. I would love to be able to buy more shares but the trading voume would probably not allow it. This company is apparently into Aerospace/Defense Products & Services
Why?
Stock is starting to form a “W”. IMHO a “W” formation points to a “WINNER”.

Stock chart of AIRI trading on AMEX. Chart courtesy of www.tradingview.com
Disclaimer: This post is not meant as Investment Advice, nor is it advice to buy or sell any shares in any company.. Do your own Due Diligence. Seek out the advice of your own financial and investment advisors before risking any funds in the Stock or Futures Markets. You can lose money and even all of it when investing at the Stock Market Casinos. This post is for my own educational purposes.
Posted by Vincent Banial
Buying 10,000 shares of NVDA (NVidia Corp) on Nasdaq at Open at Market on Apr 30
NVidia sells well respected High Performance Video Cards for Personal Computers. They are also involved in super high performance computer centers (Super Computers) and also Cloud Gaming Servers.
This will be a Technical Buy based on the CCI and Woodies CCI. Have placed a Market Order to buy 10,000 shares of NVDA (NVidia Corp) on Nasdaq at Official Market Open on Apr 30. I do not do off hours trading. Wish I could afford to buy 1 Million shares of NVDA

NVDA – NVidia Corp on Nasdaq. Chart courtesy of www.tradingview.com
Resistance between $185 and $190. Target to sell at $205 once the initial Resistance is broken. This will be a short Term Swing Trade of roughly about a month.
Disclaimer: This post is not meant as Investment Advice, nor is it advice to buy or sell any shares in any company.. Do your own Due Diligence. Seek out the advice of your own financial and investment advisors before risking any funds in the Stock or Futures Markets. You can lose money and even all of it when investing at the Stock Market Casinos. This post is for my own educational purposes.
Posted by Vincent Banial
Buying 1 Million Shares of PINS (Pinterest Inc) on the NYSE at open tomorrow Apr 30
Shares of PINS will be added to the regular portfolio. I will buy 1 Million shares of PINS (Pinterest Inc) on the NYSE at open tomorrow Apr 30.
The Pinterest IPO came out 7 days ago.
PINS share prices have risen each and every day since. The trading volume increased today.

PINS-Pinterest Inc on the NYSE. Chart is courtesy of http://www.tradingview.com
Disclaimer: This post is not meant as Investment Advice, nor is it advice to buy or sell any shares in any company.. Do your own Due Diligence. Seek out the advice of your own financial and investment advisors before risking any funds in the Stock or Futures Markets. You can lose money and even all of it when investing at the Stock Market Casinos. This post is for my own educational purposes.
Posted by Vincent Banial
Stock Trades Review
TWTR – in play today – bought for the long term
AAN and MTP – consolidating. With MTP the key is to stay above $2,00
HELE – in play today – did not get filled as price continues to rise and I wanted to buy in at a lower price.
Low price stocks – SCKT and AKTX – did not buy – they are also consolidating after the Gap Up…
So last week was a fun week for Gap Trading. A Gap Up indicates that the Trend should change upwards. The problem is after the Gap the price can consolidate – often forming a flag or pennant, before the price continue back upwards.
Posted by Vincent Banial
Low Priced Breakput stocks from last week. SCKT on Nasdaq (Socket Mobile, Inc.) and AKTX on Nasdaq (Akari Therapeutics, Plc).
Tried to buy 10,000 shares on Apr 26 of SCKT on Nasdaq (Socket Mobile, Inc.) at open tomorrow at fixed offer of $2.35 per share which was the close on Apr 25.
Why?
Triangle Breakout upwards. Their Gross Margin is over 50% for the Mobile Scanners they sell. Good luck making that kind of gross margin selling Computer Tech gear. I don’t think that Apple make over 50% gross margin. Small company turned a profit last quarter versus a loss previously. sat at the $2 barrier for a while. Now $2 is a nice support area. Target – potential Double…
Why?
They have had positive Phase 2 Medical Study Coversin Trial Results. Today the stock price Gapped Up on a high volume increase. The price came back down at the end of the regular trading day but still gapped up overall. Since the target is $6.00 I’ll set a sell stop at $5.75 to $5.90, just under the potential target.
Did not get filled. Not enough volume for 1 Million Share order. I still think it’s a nice breakout stock.
https://finance.yahoo.com/quote/AKTX/chart…
Disclaimer: I am not an registered Stock Analyst nor a licensed Stock Advisor. This post is not a suggestion for anyone to buy anything. Please seek the advice of your own licensed Investment Advisor before placing bets at the Stock Market Casinos. You can lose money – even all of it. This post is for my own educational purposes…
Posted by Vincent Banial
Bought 1 Million Midatech Pharma PLC American Depositary Shares (MTP) on Nasdaq on Apr 24 at $3.60 per share
Had posted thin on our Uniquely Toronto Facebook page. Moving it over this to this site.
This is the last of the buys for the Regular Portfolio from last week. Bought 1 Million shares of Midatech Pharma PLC American Depositary Shares (MTP) on Nasdaq on Apr 24 at $3.60 per share.
Why.
Major Price Breakout upwards with a huge spike in Volume. IMHO Volume Spike usual tend to indicate the Trend Direction will change. Expected price consolidation after price spike. Did not expect the price to drop this much. Holding, as this should bounce back up after hitting support
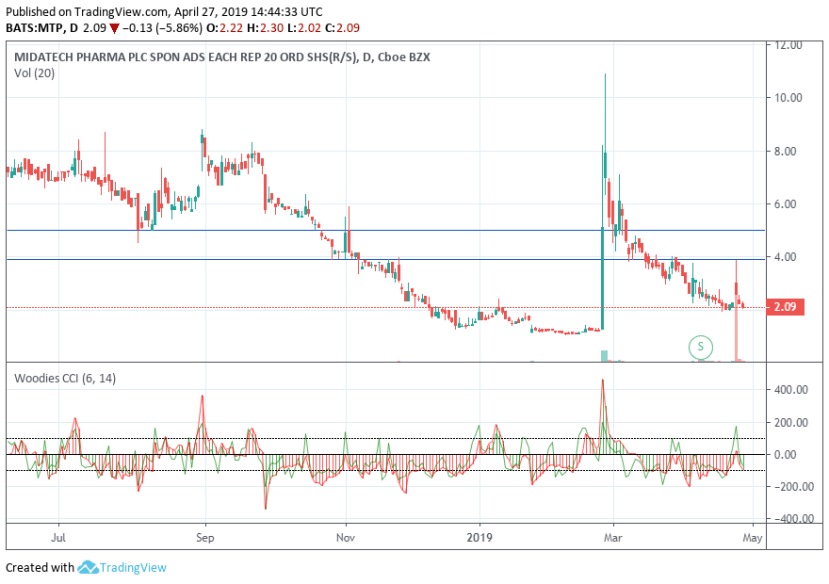
Midatech Pharma Plc (MTP) on Nasdaq. Chart courtesy of www.tradingview.com
When the price spiked up on Apr 24 it hit resistance and came back. Once the price starts back up and goes through that resistance (just under $4.00) the price should rise to the next resistance level around $5.00. Will likely try to sell around $4.90 per share. Yes, this trade is sitting at a loss, but IMHO the price is above the Support level and so I’m going to be patient and give this trade some time.
This stock is an example of the danger of trading Gaps. If I were to sell now, I would take a major hit. In contrast, look at the price of HELE since it Gapped. The price of HELE has risen daily since the Gap day. Hard to predict short term price action. I’m playing MTP for the longer term.
Disclaimer: I am not an registered Stock Analyst nor a licensed Stock Advisor. This post is not a suggestion for anyone to buy anything. Please seek the advice of your own licensed Investment Advisor before placing bets at the Stock Market Casinos. You can lose money – even all of it. This post is for my own educational purposes…
Posted by Vincent Banial
Next week I will try to buy 1,000 shares of HELE (Helen of Troy Limited) on Nasdaq at $135.50
Will try to buy 1,000 shares of HELE (Helen of Troy Limited) on Nasdaq at $135.50. It was trading a bit above $139.00 all Friday and closed a bit higher than that. I tried getting filled on Friday, but did not. I will try again next week. $135 is the Support level. Price should consolidate for a few days next week. If I get 1,000 shares at 135.50 per share, then will likely sell at $144.40.
From the latest Earnings Call Conference on April 26 : “This quarter caps great full year results. Net sales for the full fiscal year 2019 grew 5.8%. Leadership Brands grew 8.9%. Online sales grew approximately 28%, and adjusted diluted EPS grew 11.3%“

HELE (Helen of Troy Limited) on Nasdaq. Chart Courtesy of www.tradingview.com
Disclaimer: I am not an registered Stock Analyst nor a licensed Stock Advisor. This post is not a suggestion for anyone to buy anything. Please seek the advice of your own licensed Investment Advisor before placing bets at the Stock Market Casinos. You can lose money – even all of it. This post is for my own educational purposes…
Posted by Vincent Banial
Purchased 1 Million Shares of Twitter Inc (ticker TWTR on Nasdaq) this week.
I had posted this trade to our Uniquely Toronto Facebook page earlier this week. Am now brining that post to this site. Earlier this week I had purchased 1 Million shares of Twitter Inc on the NASDAQ exchange.
I am also going to split up the trading into two different portfolios. The reason for that is Low Priced shares of rather unknown companies can be a good vehicle for trading. My problem has been that you cannot get large quantity orders filled because their trading volume is too low. That situation could also come back and bite one, when they try to sell or quickly Dump a large number of shares. For example the 1 Million shares of Twitter was no problem to get filled. When I want to sell, it will also not be an issue. I’ll post the other stocks that I had posted about on our Facebook page.
So we’ll have the Regular Portfolio and we’ll have a New Trader Portfolio. The Twitter Trade is part of the Regular Portfolio. The low price shares will go into the New Trader Portfolio. This way I can pick up 1,000 shares without issue. One thing which I had picked up on and is my opinion that the more shares that you can buy, the higher your Potential capital Gains can be – and yes the Higher that your capital Losses can be. IMHO high priced stocks are not as volatile as their low cost cousins.
Ok back to Twitter. Twitter released their latest Quarterly result which beat street estimates. Fundamentals look great. The price had Gapped up – positive Technical sign especially when the price is in an extended Up Trend. So I bought One Million shares of TWTR on Nasdaq for an average cost of $39.30 per share.
Note the Low made on July 24 2018 at $41.59. That is my initial Target. There is greater resistance just above at $42.50 – another target would be just below that, say at $42.40. If the price fills that prior gap made on June 11 2018 then the next major resistance is at $45.00. The High Made on July 09 2018 at $46.90 is the next Target. IMHO in time the price of TWTR could break above that prior High. The next resistance would at $50.00, so I would sell at say $49.40. IMHO TWTR has nice potential for a nice Capital Gain over a bit of longer term. This was not bought for Day Trading or Swing Trading. This was bought to try and capture the Capital Gains under the “Investment” clause of the Tax act and so I would get 50% of the Capital Gain TAX FREE (in Canada).
After a Gap Up, a stock price will consolidate for a few days before continuing on it Up Trend. The price usually create a flag or pennant formation before moving up higher again. It’s just a matter to patiently wait…

Twitter Stock Chart courtesy of http://www.tradingview.com
The following is what I had posted on FB on Apr 23 at 10:02 pm:
“Buying a million shares of Twitter at open tomorrow Apr 24. TWTR on Nasdaq. Resistance is the bottom on the Gap formed on July 24 2018 ($41.59). That could be a target to get out. If it breaks up thru the resistance then next resistance is at $46.75 to $46.90. If it breaks upward past $47.79 then looking for $50.
Why am I buying? Strange for me, but because of Fundamentals. Twitter’s quarterly report surpassed Analyst Expectation. You also have the Twitter promoter in the White House who gets Twitter mentioned in the news almost on a daily basis. On top of Fundamentals the CCI looks great. So in my opinion I am buying because of Fundamentals and also because of Technicals.“
Disclaimer: I am not an registered Stock Analyst nor a licensed Stock Advisor. This post is not a suggestion for anyone to buy anything. Please seek the advice of your own licensed Investment Advisor before placing bets at the Stock Market Casinos. You can lose money – even all of it. This post is for my own educational purposes..
Posted by Vincent Banial
Bought 1,000 shares of AAN on the NYSE today
Have been posting some of my trading to the Uniquely Toronto Facebook page. Bringing this trade over to this our main site.
Purchased 1,000 shares of AAN (Aaron’s, Inc.) on the NYSE this morning. Picked up the 1,000 shares for $58.00 per share.
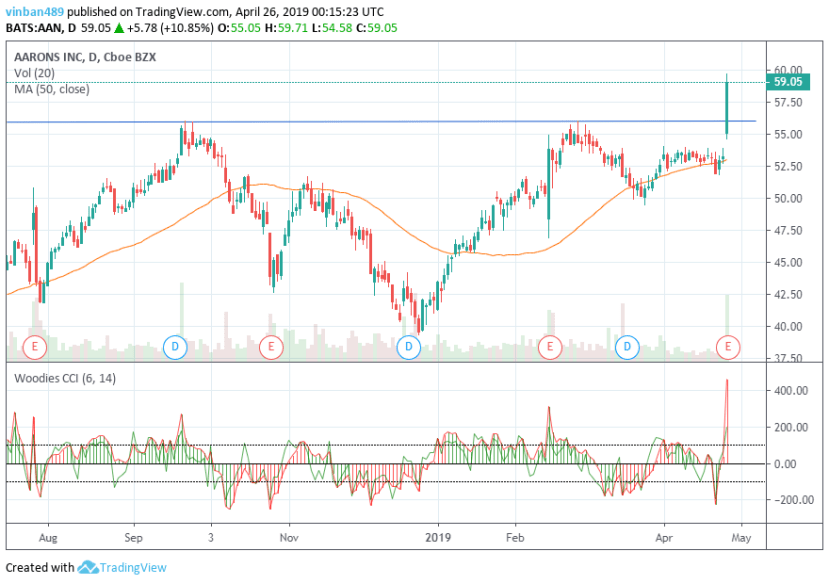
AAN shares trading on NYSE Courtesy of Tradingview.com
Reasons why I bought 1,000 AAN shares on the NYSE today::
Prior day Close was $53.27.
Today’s open was $55.05, Which means the Price Gapped UP (ie lots of buyers).
Much Higher Volume than normal at 1.5 Million shares.
Price moved above $56.04, which was the prior high set on Feb 27.
50 Day Moving Average is showing the price is in an extended Uptrend.
The Low of Feb 14 was not surpassed by the low on March 25.
So you had a Higher Low on March 25 which gives an indication
that the trend upward should continue.
Earning Per share rose over 30% in the reported Quarter.
So the Technicals looked great as did the Fundamentals.
I am not an registered Stock Analyst nor a licensed Stock Advisor. This post is not a suggestion for anyone to buy anything. Please seek the advice of your own licensed Investment Advisor before placing bets at the Stock Market Casinos. You can lose money – even all of it. This post is for my own educational purposes…
Posted by Vincent Banial
Shares prices tumbled in Asia on Monday after Wall Street’s share price drop last Friday
Shares prices tumbled in Asia on Monday Mar 25. The drop in Asia is being linked to the Friday Mar 22 drop on North American Stock Markets. The Japan’s Nikkei Index dropped over 3%. The Hong Kong market’s Hang Seng Index dropped over 2%.
Video is courtesy of the The Money GPS YouTube channel
Surprising that the Market Indexes on US exchanges have held steady all morning (some have a minor rise in their Index). It’s lunch time and so trading drops off and we will see what happens after 3PM EST.
I’m surprised that the US Stock Market Indexes have not had a rather Down day today. When the markets tank on a Friday, often that does negatively impact trading the following Monday. We’ll see how the day ends.
Click on this link to visit the CNN Business website to view their page of Stock Market results in Asia for Monday Mar 25.
Posted by Vincent Banial
Inverted Yield Curve indicates that a Recession is coming!
An Inverted Yield Curve has historically been a reliable signal that a Recession is on its way! You get an Inverted Yield Curve when short-term yields are higher than longer-term yields.
The Dow Index dropped over 460 points today Fri Mar 22 2019. The S&P Index fell 1.9% and the Nasdaq dropped 2.5%. The Russell 200 fell over 3.6%.
Click on this link to visit the Nasdaq website and view the Stock Market Indices.
Video is courtesy of The Money GPS YouTube channel
A drop in the Stock Markets on a Friday
is NOT A GOOD THING!
Why?
People will have Sat and Sun to get worried. When Investors get worried they tend to Sell. I believe that Monday Mar 25 will be another down day in the Stock Markets.
Next Monday’s drops should be greater than today’s drops.
Click on this link to visit the CNBC website to read their news article titled “Dow drops more than 450 points, S&P 500 posts worst day since January amid global growth worries“.
Posted by: Vincent Banial
Aurora Cannabis order for 1 million shares filled at open Dec 29 at $9.25 per share
Update: 1 Million shares of ACB Aurora Cannabis Inc filled at open Dec 29 at $9.25 per share.
IMHO this stock should Gap up when the markets open after New Years. Nice moves on a Friday before a Holiday, often are pre-cursors to nice moves when the markets reopen.
This post is not meant to be any kind of investment advice. Please do your own Due Diligence and speak to your own Licensed Financial Advisor beofre placing any bets at the Stockl markat casinos. You can lose money, possibly all of it.
Aurora Cannabis Inc breaking out on the Toronto Stock Exchange
On Dec 29 I will purchase one million shares of ACB (Aurora Cannabis Inc) at the open price for our Test Portfolio.
On Dec 28 the price closed at $8.94 per share.
My Sell Stop will be at $8.50
Risk will be $0.44 per share. Target Sell price IMHO could hit $14 per share. Risk vs Reward in my opinion is interesting.
This post is not Investment Advice to buy shares of Aurora Cannabis Inc on the Toronto Stock Excahnge or on Nasdaq. Do your own Due Diligence and speak to your own investment advisor before placing any bets at the Stock Market Casinos. You could lose money, possibly all of it.
Stock chart courtesy of the Toronto Stock Exchange at https://web.tmxmoney.com
50% to 60% Market Correction was discussed by John Hussman who had called the Tech Crash of 2000. Watch your Sell Stops.
Posted by: Vincent Banial
Heads Up.
Watch your Sell Stops.
Talk about a 50% to 60% (or more)
Stock Market Correction (CRASH).
Back in Jan 2017 the Huffington Post ran an article in which Robert Shiller discussed the similarity between President Trump and past U.S. President Calvin Coolidge. After President Coolidge left the Oval Office, the1929 Market Crash happened.
Fortune has now posted an article about John Hussman which was titled: “Famed Investor Predicts Historic Market Drop“.
Video is courtesy of the Tip TV Finance YouTube channel
Click on this link to read a prior post by John Hussman titled “Estimating the Risk of a Market Crash.”
Click on this link to read the latest post by John Hussman where he details that there could be a U.S. Stock market Correction in the order of a 50% to 60% (last paragraph).
Click on this link to visit the Wikipedia page about the 1929 Stock Market Crash.
Disclaimer: The above post does not provide Investment Advice. Speak to your own Investment Advisor before placing any bets in the Stock Markets. Do Your Own DUE DILIGENCE. The above post is for entertainment purposes only.
When the Sunspot Cycle peaks, so could the stock market based on the Dow30 index
This is one way to possibly forecast how the US Stock Market (Dow 30 Index) could be doing. Check a Historical DOW30 Index chart to see when the Peaks occurred. Then check the Sunspot Cycle chart below.

Sunspot chart is courtesy of our friends at NASA at the Marshall Space Flight Center.
Click on this Link to display a Historic Chart of the DOW30 Index courtesy of the Stockcharts.com site (sorry but can’t get the embed code to auto display).
Sunspots run in cycles and In My Opinion so does the US Stock Market (your mileage may of course differ).
Posted by: Vincent Banial
http://www.uniquelytoronto.com
Disclaimer: The above is not meant as Financial or Investment advice. I am not a registered Financial or Investment advisor. Do your own Due Diligence. Always seek out the advice from your own Financial and Investment Professionals before placing any bets at the Financial Markets casinos called the Stock Market. You can lose money, possibly all of it, when buying and selling or trading stocks. The above is not a recommendation to buy or sell the DOW30 Index or any other stock. The above post is for Entertainment purposes only.
Made my first Equity Trade in a long time
Wow, what a reminder. I have not traded stocks in far too long. Last night I tried setting up some charting software. Checked my old trading PC.
Today I setup a laptop which will be dedicated to Trading and Investing. Everything worked. A lot of very fond memories came flooding back. Some of the stocks which I had played in the past were in play today – up over 10%.
Level 2 Bid Ask screen was a joy to see again. I never realized how much I missed doing this.
My trading was based on self taught Technical Analysis. Research is something that I had learned to appreciate when I worked under at IBM Head Office. Research can open doors. Trading and investing is essentially psychological and I know a fair bit about that. Spending time researching obscure trading ideas paid off. Now all I have to do is refresh the memory cells.
It was funny looking at charts, some of old thinking came back.It’s about playing when the odds are in your favour and sitting back and “doing nothing” when they are not. People generally over trade, because they miss the thrill ( I understand that one today) or they want to pay the market back after taking a loss.
Anyhow, the trade got filled. It was a real buzz watching the Bid Ask Level2 to get an idea where the price was gonna go.
I can’t believe how much I missed this.
Have to get AmiBroker setup (love that software) and other pgms. I even have thoughts of setting up my Trading Room again.
Look for more Trading and Investing oriented posts.
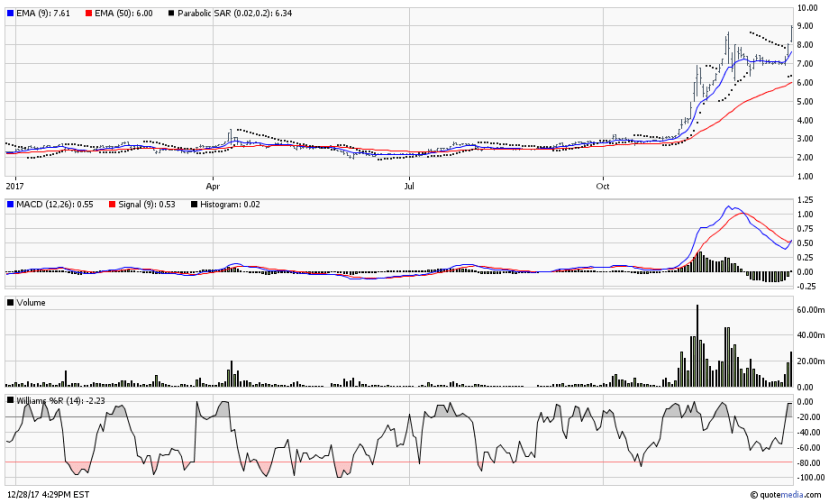
One Penny Stock which I had played in the past (no longer own shares of it) was ULI.V UltraLithium trading in Vancouver. It came up on my brokers screen (I think that years back I had added it to the watch list). I’ve included a link to a chart of ULI.V, thanks to the good folks at StockCharts.com. ULI.V would have been a really nice trade in Feb 2016 when the Moving Averages crossed. Moving Average crosses do work, but I would have confirmed that signal with other stuff like the Commodity Channel Index behaviour. Just click on the link below to view the chart of ULI.V
I feel like a kid being let loose in a huge Candy Store.
USA TODAY: “Market crash robs $2.3T from investors”
They have dropped the price of Crude Oil to help bolster Western economies. Had the price of Oil not dropped, then IMHO we would have had a major Stock market Crash last year – 1929 style. Thankfully we have not “Yet” had a Stock Market Crash.
The US employment figures are a figment of the Government’s Imagination. There are record numbers of Americans (over 94 Million) who “stopped” looking for work. Why? Because they could NOT find any….
A new article posted by USA Today, goes into some detail of the stocks which fell in price.
I just hope that they can continue to drop the price of Crude Oil. That is the only thing which in my opinion is propping everything up.
Posted by: Vincent Banial
http://www.uniquelytoronto.com
Disclaimer: Any Trademarks mentioned in this post are owned by the respective Trademark owner. There could be unintentional errors or omissions in this post. Always refer to the official sites to confirm details and any ongoing changes or updates. This post is subject to change without notice./em>
