
Tagged: Investing & Trading
Bought 1,000 shares of AAN on the NYSE today
Have been posting some of my trading to the Uniquely Toronto Facebook page. Bringing this trade over to this our main site.
Purchased 1,000 shares of AAN (Aaron’s, Inc.) on the NYSE this morning. Picked up the 1,000 shares for $58.00 per share.
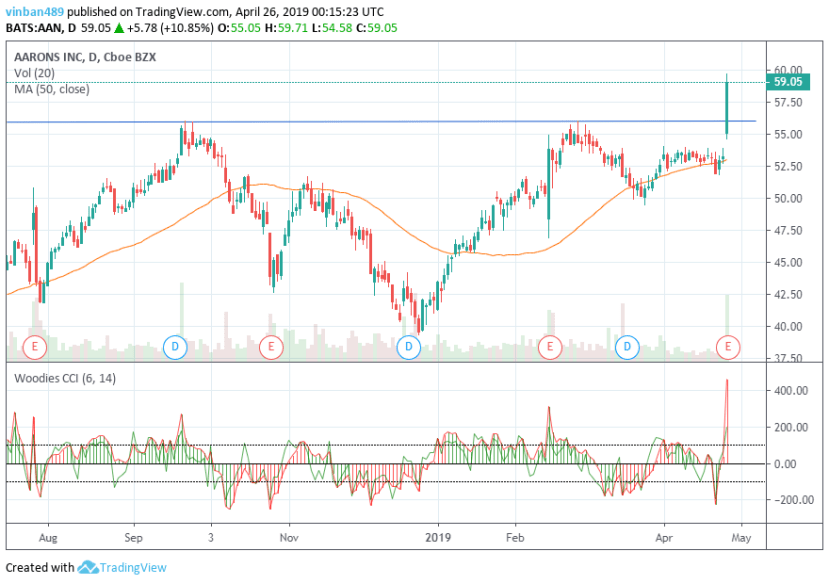
AAN shares trading on NYSE Courtesy of Tradingview.com
Reasons why I bought 1,000 AAN shares on the NYSE today::
Prior day Close was $53.27.
Today’s open was $55.05, Which means the Price Gapped UP (ie lots of buyers).
Much Higher Volume than normal at 1.5 Million shares.
Price moved above $56.04, which was the prior high set on Feb 27.
50 Day Moving Average is showing the price is in an extended Uptrend.
The Low of Feb 14 was not surpassed by the low on March 25.
So you had a Higher Low on March 25 which gives an indication
that the trend upward should continue.
Earning Per share rose over 30% in the reported Quarter.
So the Technicals looked great as did the Fundamentals.
I am not an registered Stock Analyst nor a licensed Stock Advisor. This post is not a suggestion for anyone to buy anything. Please seek the advice of your own licensed Investment Advisor before placing bets at the Stock Market Casinos. You can lose money – even all of it. This post is for my own educational purposes…
Posted by Vincent Banial
Made my first Equity Trade in a long time
Wow, what a reminder. I have not traded stocks in far too long. Last night I tried setting up some charting software. Checked my old trading PC.
Today I setup a laptop which will be dedicated to Trading and Investing. Everything worked. A lot of very fond memories came flooding back. Some of the stocks which I had played in the past were in play today – up over 10%.
Level 2 Bid Ask screen was a joy to see again. I never realized how much I missed doing this.
My trading was based on self taught Technical Analysis. Research is something that I had learned to appreciate when I worked under at IBM Head Office. Research can open doors. Trading and investing is essentially psychological and I know a fair bit about that. Spending time researching obscure trading ideas paid off. Now all I have to do is refresh the memory cells.
It was funny looking at charts, some of old thinking came back.It’s about playing when the odds are in your favour and sitting back and “doing nothing” when they are not. People generally over trade, because they miss the thrill ( I understand that one today) or they want to pay the market back after taking a loss.
Anyhow, the trade got filled. It was a real buzz watching the Bid Ask Level2 to get an idea where the price was gonna go.
I can’t believe how much I missed this.
Have to get AmiBroker setup (love that software) and other pgms. I even have thoughts of setting up my Trading Room again.
Look for more Trading and Investing oriented posts.
One Penny Stock which I had played in the past (no longer own shares of it) was ULI.V UltraLithium trading in Vancouver. It came up on my brokers screen (I think that years back I had added it to the watch list). I’ve included a link to a chart of ULI.V, thanks to the good folks at StockCharts.com. ULI.V would have been a really nice trade in Feb 2016 when the Moving Averages crossed. Moving Average crosses do work, but I would have confirmed that signal with other stuff like the Commodity Channel Index behaviour. Just click on the link below to view the chart of ULI.V
I feel like a kid being let loose in a huge Candy Store.
PFSW trading on Nasdaq breakout on Mar 27 2013

PFSW trading on Nasdaq Break out on Mar 27 2013. Photo credit ccvic.zenfolio.com
Time for another discussion about stock trading. If you don’t have a charting program, I would highly recommend checking out AmiBroker. You can Download a free 30 day clicking on the following link: AmiBroker official site with 30 day trial.
Today’s topic will be PFSW, which trades on the Nasdaq. On Mar 27, that stock had a gap up at Open and continued on it’s merry way. Continue reading
GuestLogix Inc. Breakout. Trading on the Toronto TMX exchange, as symbol GXI
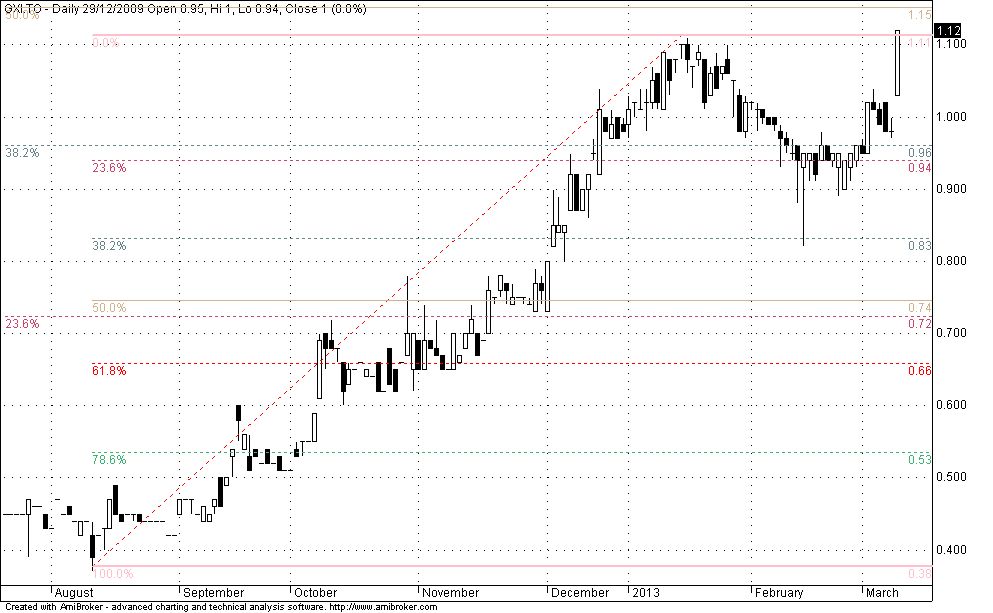
GuestLogix Stock Chart – Shorter Term View – symbol GXI trading on stock exchange in Toronto. Price Breakout on Mar 11
Time for another Trading / Investing related post. It’s been a while since the prior post about trading Ford shares. Two stock charts were added to this post. Both are daily charts. One shows a longer term view and the other short-term view. Both also have Fibonacci ratios plotted on them. Continue reading
Stock Trading FORD – Sell Stop Hit Jan 29 2013 – Capital Gain of $3.54 per share.
 Stock chart of FORD stock created by Vincent Banial using AmiBroker charting software
A family member had bought some FORD shares. He bases his buys on Fundamentals. I’m a visual person, so numbers don’t have as much meaning as does a picture or a stock chart. Continue reading
