
Tagged: stock market
QQQs have moved up. Stock Market rally continues
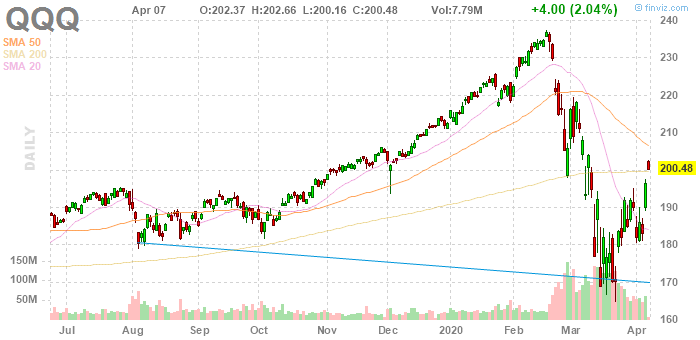
The stock chart of the QQQ is courtesy of finviz.com.
Note that the price move up above the 200 Day Moving Average. Note also, that the 20 day MA seems to have bottomed and looks to be starting to curl back up. When the price sits between the 200 Day MA and the 50 Day MA it could break up above the 50 Day MA. I suspect that the price will now sit between the 50 Day MA and the 200 Day MA
The rise IMHO is not the result of non professional stock traders. It takes deep pockets to move the market so rapidly. Note also that a ” W” shape has formed which IMHO is a bullish sign. All this points to a market bottom having been established??? If so I’m surprised and shocked at this turn around.
One idea that has crossed my mind is that if the stock markets stay down then the sitting US president will likely not get re-elected. That would mean the potential for future taxes on the wealthy instead of further Tax Breaks. If the US Stock Market goes back near or above the prior Highs, then the sitting president will very likely get re-elected. Those who can protect themselves, will. It is just strange to see this, as this is vastly different stock market behaviour say compared to 2007 and 2008. Back then the rally back up started around 2009.
I got interested in the QQQ ETF because there are Options available. With one low cost option, I can control 100 shares of the QQQ. I caught the drop around Apr 01 via a QQQ PUT Option trade.
| DATE | TRADE TYPE | SYMBOL | QUANTITY | TARGET PRICE | PRICE | COMMISSION | TOTAL CASH VALUE | |
|---|---|---|---|---|---|---|---|---|
| 4/2/2020 9:57 AM | Option: Sell to Close at Market Open | QQQ2003P190 (QQQ 190 – Fri 2020) | 10 | $7.92 | $19.50 | $7,900.50 | ||
| 4/1/2020 10:00 AM | Option: Buy to Open at Market | QQQ2003P190 (QQQ 190 – Fri 2020) | 10 | $6.46 | $19.50 | $6,479.50 |
I have not played the rally but I hope that this rally back up continues…
This post is for my educational purposes. Please seek out the advice of your own professional Investment Advisor before placing any bets at the Stock Market Casinos. You can lose money playing the Stock Market, even all of it.
PFSW trading on Nasdaq breakout on Mar 27 2013

PFSW trading on Nasdaq Break out on Mar 27 2013. Photo credit ccvic.zenfolio.com
Time for another discussion about stock trading. If you don’t have a charting program, I would highly recommend checking out AmiBroker. You can Download a free 30 day clicking on the following link: AmiBroker official site with 30 day trial.
Today’s topic will be PFSW, which trades on the Nasdaq. On Mar 27, that stock had a gap up at Open and continued on it’s merry way. Continue reading
Beware of the Ides of March.
Back when Rome ruled Europe and the Middle East, the Ides of March was a day dedicated to Mars the God of War. March usually brings with it the first signs of Spring. With change comes uncertainty.

English: North Korea (Photo credit: Wikipedia)
North Korea has indicated that it will cancel the 1950s Cease Fire Agreement with South Korea. Tentatively the date for that action is said to be Mar 11. Not a good omen, especially in the year of the venomous Water Snake. Continue reading
Stock Trading FORD – Sell Stop Hit Jan 29 2013 – Capital Gain of $3.54 per share.
 Stock chart of FORD stock created by Vincent Banial using AmiBroker charting software
A family member had bought some FORD shares. He bases his buys on Fundamentals. I’m a visual person, so numbers don’t have as much meaning as does a picture or a stock chart. Continue reading
