
Category: Stock Market Performance during Presidential Term in Office
QQQs have moved up. Stock Market rally continues
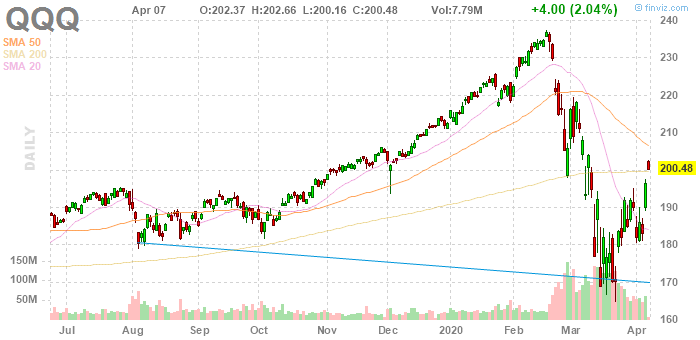
The stock chart of the QQQ is courtesy of finviz.com.
Note that the price move up above the 200 Day Moving Average. Note also, that the 20 day MA seems to have bottomed and looks to be starting to curl back up. When the price sits between the 200 Day MA and the 50 Day MA it could break up above the 50 Day MA. I suspect that the price will now sit between the 50 Day MA and the 200 Day MA
The rise IMHO is not the result of non professional stock traders. It takes deep pockets to move the market so rapidly. Note also that a ” W” shape has formed which IMHO is a bullish sign. All this points to a market bottom having been established??? If so I’m surprised and shocked at this turn around.
One idea that has crossed my mind is that if the stock markets stay down then the sitting US president will likely not get re-elected. That would mean the potential for future taxes on the wealthy instead of further Tax Breaks. If the US Stock Market goes back near or above the prior Highs, then the sitting president will very likely get re-elected. Those who can protect themselves, will. It is just strange to see this, as this is vastly different stock market behaviour say compared to 2007 and 2008. Back then the rally back up started around 2009.
I got interested in the QQQ ETF because there are Options available. With one low cost option, I can control 100 shares of the QQQ. I caught the drop around Apr 01 via a QQQ PUT Option trade.
| DATE | TRADE TYPE | SYMBOL | QUANTITY | TARGET PRICE | PRICE | COMMISSION | TOTAL CASH VALUE | |
|---|---|---|---|---|---|---|---|---|
| 4/2/2020 9:57 AM | Option: Sell to Close at Market Open | QQQ2003P190 (QQQ 190 – Fri 2020) | 10 | $7.92 | $19.50 | $7,900.50 | ||
| 4/1/2020 10:00 AM | Option: Buy to Open at Market | QQQ2003P190 (QQQ 190 – Fri 2020) | 10 | $6.46 | $19.50 | $6,479.50 |
I have not played the rally but I hope that this rally back up continues…
This post is for my educational purposes. Please seek out the advice of your own professional Investment Advisor before placing any bets at the Stock Market Casinos. You can lose money playing the Stock Market, even all of it.
US Stock Market performance by Presidential Term in Office
Please checkout the Macrotrends website. They provide US Stock Market Historical performance charts and data.
The chart below, created by Macrotrends, is of the US Stock Market Performance during each US President’s Term in Office.
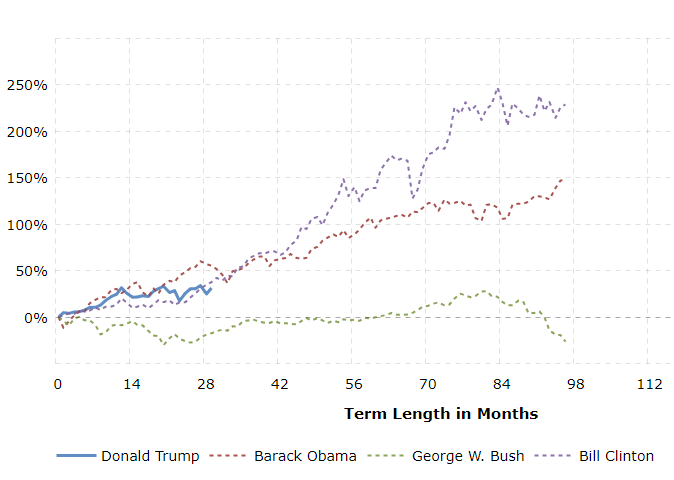
Stock Market Performance by Presidential Term. Chart courtesy of https://www.macrotrends.net/1319/dow-jones-100-year-historical-chart
When you visit the Macrotrends site to view the chart, plse click on Bill Clinton’s name to include his results on the chart display. Also please scroll further down the page, as there is also a data chart of the Dow Jones Industrial Average – Historical Annual Data. The Macrotrends site is a really helpful resource.
I posted this because of news about President Trump’s Twitter post from Jun 15 2019 posted at 6:44am: “The Trump Economy is setting records, and has a long way up to go….However, if anyone but me takes over in 2020 (I know the competition very well), there will be a Market Crash the likes of which has not been seen before! KEEP AMERICA GREAT“.
There was a great post on Forbes.com by Chuck Jones, which is titled: “Two Charts Show Trump’s Job Gains Are Just A Continuation From Obama’s Presidency“.
Posted by Vincent Banial
