
Category: stock trading
Looks like Bed Bath & Beyond Inc stock price (BBBY) is breaking out
I was checking the QQQ Stock chart on Finviz and noticed that the chart of BBBY looks to me like it is breaking out.
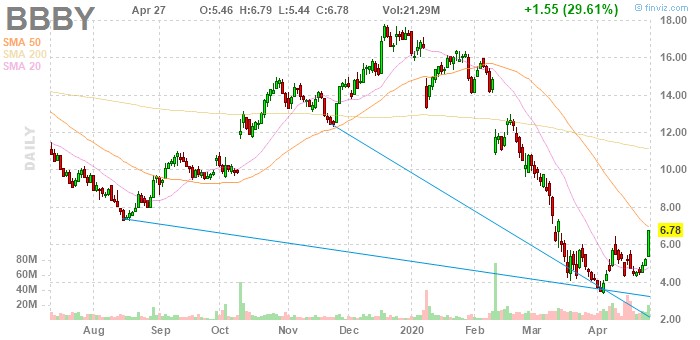
In my opinion the first target could be $10 which is just under the 200 day MA. Back when I traded equities, I would Swing Trade and not buy and hold. The chart also looks to me like it formed a “W” shaped bottom. Price hit bottom below $4 and moved up. Then the price corrected back down. Now this leg back up also went higher than the prior high set back in April.
This post is not meant as investment advice. Please seek out the help and advice of your own Investment Advisor. You can lose money, even all of it, when placing bets at the Stock & Options Market Casinos. Posted for my own education. I’m trying to learn ways to trade the QQQ Options and happened to notice the stock chart of BBBY.
Posted by Vincent Banial
QQQs have moved up. Stock Market rally continues
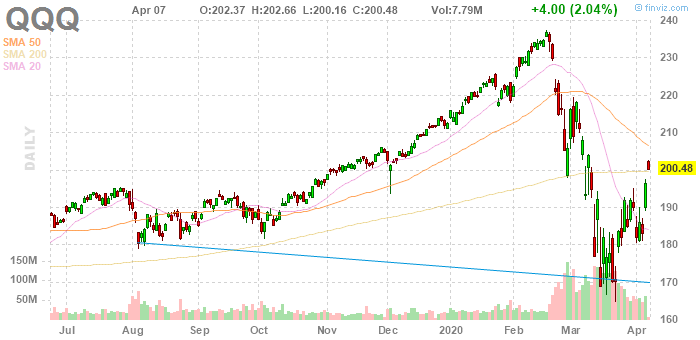
The stock chart of the QQQ is courtesy of finviz.com.
Note that the price move up above the 200 Day Moving Average. Note also, that the 20 day MA seems to have bottomed and looks to be starting to curl back up. When the price sits between the 200 Day MA and the 50 Day MA it could break up above the 50 Day MA. I suspect that the price will now sit between the 50 Day MA and the 200 Day MA
The rise IMHO is not the result of non professional stock traders. It takes deep pockets to move the market so rapidly. Note also that a ” W” shape has formed which IMHO is a bullish sign. All this points to a market bottom having been established??? If so I’m surprised and shocked at this turn around.
One idea that has crossed my mind is that if the stock markets stay down then the sitting US president will likely not get re-elected. That would mean the potential for future taxes on the wealthy instead of further Tax Breaks. If the US Stock Market goes back near or above the prior Highs, then the sitting president will very likely get re-elected. Those who can protect themselves, will. It is just strange to see this, as this is vastly different stock market behaviour say compared to 2007 and 2008. Back then the rally back up started around 2009.
I got interested in the QQQ ETF because there are Options available. With one low cost option, I can control 100 shares of the QQQ. I caught the drop around Apr 01 via a QQQ PUT Option trade.
| DATE | TRADE TYPE | SYMBOL | QUANTITY | TARGET PRICE | PRICE | COMMISSION | TOTAL CASH VALUE | |
|---|---|---|---|---|---|---|---|---|
| 4/2/2020 9:57 AM | Option: Sell to Close at Market Open | QQQ2003P190 (QQQ 190 – Fri 2020) | 10 | $7.92 | $19.50 | $7,900.50 | ||
| 4/1/2020 10:00 AM | Option: Buy to Open at Market | QQQ2003P190 (QQQ 190 – Fri 2020) | 10 | $6.46 | $19.50 | $6,479.50 |
I have not played the rally but I hope that this rally back up continues…
This post is for my educational purposes. Please seek out the advice of your own professional Investment Advisor before placing any bets at the Stock Market Casinos. You can lose money playing the Stock Market, even all of it.
Update on APHA and ZBISF Swing Trades
Two lesson so far. Be careful buying in May. If a stock was headed down and then reverses, maybe don’t buy the initial reversal breakout. Wait for the retest of the Low and then buy if it bounces back up.
Both APHA and ZBISF are Cannabis stocks. Bad news hit a lot of Cannabis stocks. The FDA held meetings and reports from the meetings were mixed. After those news reports, Cannabis stocks got hit – ACB for another example. The mixed news about the FDA and the downside reaction was in my opinion premature. Looks like people have realized that and the prices are back to normal.
Still holding both APHA and ZBISF.

Stock Chart of APHA – Aphria Inc. Chart create using Stockalyze.

Stock Chart of ZBISF – Zenabis Global Inc. Chart was created using Stockalyze
Disclaimer: This post is not meant as Investment Advice, nor is it advice to buy or sell any shares in any company.. Do your own Due Diligence. Seek out the advice of your own financial and investment advisors before risking any funds in the Stock or Futures Markets. You can lose money and even all of it when investing at the Stock Market Casinos. This post is for my own educational purposes.
Posted by: Vincent Banial
Buying 1,000 shares of ZBISF just before close today May 30 at Market.
ZBISF (Zenabis Global Inc) is a Canadian Cannabis stock trading Over the Counter. It is priced well under $2.00 per share and so is a “Penny Stock” and the trading volume is in my opinion “Low”. Normally liquidity is of importance. It allows one to dump, in case something goes wrong with the stock. This is being bought based on my new “After Work” Swing Trading ideas to “Test” them.
Checking the chart you see rising lows on RSI(2) and on MFI(4) and on the Detrended Osc and on the Stochastics. In my opinion, that is a safety net. If the price continues trading in the channel, then price could hit or close just above the Upper Bollinger Band. and come back to around the Middle between both bands.
Will I become a Millionaire with this trade? Sure, if the stock prices rises to over $1,000,000 US per share. That would be a historic OTC Stock move. If the Swing works out, then I might buy back in again. IMHO there looks to be upside potential. Trading volume is low and so can’t buy a lot of shares, but it’s a great chart to help confirm my new “After Work” Swing Trading idea.
Why buy at close instead of open tomorrow? I’m home today, so why not. The “After Work” idea is to buy or sell either at Open or at Close and not worry about trading during work hours (again this is not Day Trading).

Stock Chart of ZBISF – Zenabis Global Inc. Chart created using Amibroker
Zenabis Global Inc also trades on the Canadian TSX in Toronto under symbol ZENA (or ZENA.TO).
Disclaimer: This post is not meant as Investment Advice, nor is it advice to buy or sell any shares in any company.. Do your own Due Diligence. Seek out the advice of your own financial and investment advisors before risking any funds in the Stock or Futures Markets. You can lose money and even all of it when investing at the Stock Market Casinos. This post is for my own educational purposes.
Posted by: Vincent Banial
This morning’s trading in APHA – Aphria Inc
APHA started up today and then reversed. Look at the chart in my prior post. The price hit the upper Bollinger Band today. Many traders buy when the price hits or goes below the Lower Bollinger Band and then they sell (Mean Reversion) when the price hits the middle of the two bands or when then price hits the Upper Bollinger Band. Since I’m not Day Trading this, it’s not an issue. I figure then support is at $7.35 (Friday’s close)and then we’ll have a bounce back up.
Oh yea, a shout out goes to the Stocktwits.com website. One of the good folks from that site linked to my post and we’ve had a number of visitors. Thank You “exHawaiian” for mentioning my post.
Click on this link to visit the StockTwits.com website to view their discussion about APHA.
Click on this link to visit Nasdaq.com to view their real time chart of the trading of APHA so far today. I note that as the stock price retraced back down the volume went down. at 10:21AM it hit it’s low of $7.40 and bounced up. At 10:36AM is came back to retested the low at $7.40. at 10:39AM is touched $7.36. There’s a old saying: “Gaps get filled”. At 10:46AM the opening gap got filled as the stock price of APHA hit $7.35. At 10:51 it touched $7.27. The middle of the Bollinger bands is around $6.97-$6.98. The Shorts this morning could hold out to that level since support was broken at $7.35. But then again this is a Swing Trade and not a Day Trade for me. The only way for me to see if the “After Work” Swing Trading ideas work is to test them and not switch into Day Trading mode.
Disclaimer: This post is not meant as Investment Advice, nor is it advice to buy or sell any shares in any company.. Do your own Due Diligence. Seek out the advice of your own financial and investment advisors before risking any funds in the Stock or Futures Markets. You can lose money and even all of it when investing at the Stock Market Casinos. This post is for my own educational purposes.
Posted by: Vincent Banial
Order filled @ $7.62 ea for 1,000 shares of APHA (Aphrioa Inc) on NYSE this morning
The Buy order was filled this morning at $7.62 for 1,000 shares of Aphria Inc – symbol APHA on the NYSE. This stock also traded on the TSX in Toronto under symbol APHA.TO. I charted both and noted that the Momentum on the NYSE was stronger and so placed order there. The Momo would not impact the buy, but when I sell there could be more buyers in NY versus Toronto.
In hindsight, since the US markets were closed yesterday (May 27), but the TSX in Toronto was open, I should have bought at the Open on the TSX yesterday May 27. Trading in Toronto confirmed what my “After Work” Swing Trading ideas had indicated – that APHA was breaking out.

APHA (Aphria Inc) Stock Chart. Chart created by Stockalyze
Disclaimer: This post is not meant as Investment Advice, nor is it advice to buy or sell any shares in any company.. Do your own Due Diligence. Seek out the advice of your own financial and investment advisors before risking any funds in the Stock or Futures Markets. You can lose money and even all of it when investing at the Stock Market Casinos. This post is for my own educational purposes.
Posted by: Vincent Banial
Buying 1,000 shares of APHA at Open May 28 on NYSE at Market
I have been taking time lately to work on my “After Work” Swing Trading system. One that I don’t have to monitor the market every minute as with Day Trading. This way I can go to work and not worry. When I return home I can then check to see what’s happening and post the Buy or Sell orders for the next day as needed. I normally trade regular market hours.
My attraction for Price Gap Ups has to be curtailed. Gaps come back and fill, this month has shown me – yet again. Also Investing for the long term bugs me, as you have to absorb price drops and not sell. The month of May showed me how painful that can be. In the long term (as in years), I’m of the opinion that it will work out, but short term those price drops are painful to watch and sit tight.
My new “after work” system is based on tried and true work done by others. I use the 2 Period RSI – yes 2 period. Because the RSI does not take volume into account, I also include a 4 period Money Flow Index. Why? Drawing trend lines on the MFI can give me insight into the stock trend. For example MFI(4) is making lower lows, while the RSI(2) is indicating a potential trade. Ya the trade could work for say one day and come back because the trend is not going up as per the MFI. I also add Stochastics, Williams%R and On Balance Volume. Those added Indicators can help indicate whether the stock price in trading in a channel. Could help in the future if I decide to trade Channels, but not at this time.
The price chart has the EMA(4) and EMA(9) plotted. Bollinger Bands are also added. For me it could be a buy when the price closes above the EMA(4) and Sell when it closes Below the EMA(9). With Bollinger Bands, could be a buy the next day when the price closes down below the lower Bollinger Band. Could be a sell when the price goes above the EMA(4), or wait a bit more if it might go above the EMA(9).
Individually some of the stuff mentioned is used in trading systems by others. Just check YouTube.com and you’ll find an amazing amount of info. For me, each thing on the chart gives me some insight that maybe the other things could not. The Trigger to get my attention will be the RSI(2).
Based on this new “After Work” Swing Trading System I will be buying 1,000 shares of APHA (Aphria Inc) at Open on May 28 on NYSE. APHA is a Cannabis stock. I was searching for something on the Web and noted that APHA was being plugged on one website as a great Pot Stock. I did not read the article, but did chart the stock. The pop on Friday could be due to the it being plugged on the WEB – just my opinion that such may be why. My chart “in my opinion” shows a Breakout. This will be checked in the evenings, “after work”. Will not bother checking during the day time, during market hours.

Stock Chart of APHA – Aphria Inc. Chart created by AmiBroker
Disclaimer: This post is not meant as Investment Advice, nor is it advice to buy or sell any shares in any company. Do your own Due Diligence. Seek out the advice of your own financial and investment advisors before risking any funds in the Stock or Futures Markets. You can lose money and even all of it when investing at the Stock Market Casinos. This post is for my own educational purposes.
Posted by Vincent Banial
Buy order filled for 1,000 Shares of NVDA (NVidia) at $160.05 each
Buy order filled for 1,000 Shares of NVDA (NVidia) at $160.05 each.
Disclaimer: This post is not meant as Investment Advice, nor is it advice to buy or sell any shares in any company.. Do your own Due Diligence. Seek out the advice of your own financial and investment advisors before risking any funds in the Stock or Futures Markets. You can lose money and even all of it when investing at the Stock Market Casinos. This post is for my own educational purposes.
Posted by Vincent Banial
Buying 1,000 shares of NVDA tomorrow May 14 at Open at Market
I’ll buy 1,000 shares of NVDA – NVidia tomorrow May 14 at Open at Market.
The stock markets have been hard hit thanks to US President Trump’s Tweets about more Tarrifis on Chinese Imports.
NVDA gapped Down today. It hit the long term Resistance level at around $158 to $160 and closed at ($158.03) the Resistance. CCI is in Oversold territory. My new strategy indicates do not buy. My gut says different, especially the gap down open today and then going lower to close at Resistance area. This is not a Technical nor Fundamental based buy – gut only. The candle bar today was long. I suspect overreaction because of the general bad mood the stock markets are in. This will be a short term Swing Trade.

Stock Chart of NVDA – NVidia on Nasdaq. Chart courtesy of www.tradingview.com
Disclaimer: This post is not meant as Investment Advice, nor is it advice to buy or sell any shares in any company.. Do your own Due Diligence. Seek out the advice of your own financial and investment advisors before risking any funds in the Stock or Futures Markets. You can lose money and even all of it when investing at the Stock Market Casinos. This post is for my own educational purposes.
Posted by Vincent Banial
Buy Fill 10K shares of VXRT @ $0.75 per share and 10K shares of AWSM @ $2.75 per share
Buy Orders Filled for 10K shares of VXRT (Vaxart, Inc) @ $0.75 per share and also for 10K shares of AWSM (Cool Holdings Inc) @ $2.75 per share.
Disclaimer: This post is not meant as Investment Advice, nor is it advice to buy or sell any shares in any company.. Do your own Due Diligence. Seek out the advice of your own financial and investment advisors before risking any funds in the Stock or Futures Markets. You can lose money and even all of it when investing at the Stock Market Casinos. This post is for my own educational purposes.
Posted by Vincent Banial
Buying 10,000 shares of AWSM (Cool Holdings, Inc) tomorrow May 13 at Open, at Market
Buying 10,000 shares of AWSM (Cool Holdings, Inc) tomorrow May 13 2019 at Open at Market. This is a low priced stock – last close was $2.99 US.This is part of a new Trading Strategy for me.
Click on this link to visit stockcharts.com to view their chart of AWSM.
Disclaimer: This post is not meant as Investment Advice, nor is it advice to buy or sell any shares in any company.. Do your own Due Diligence. Seek out the advice of your own financial and investment advisors before risking any funds in the Stock or Futures Markets. You can lose money and even all of it when investing at the Stock Market Casinos. This post is for my own educational purposes.
Posted by: Vincent Banial
Buying 10,000 shares of VXRT (Vaxart, Inc) tomorrow May 13 at Open, at Market
Buying 10,000 shares of VXRT (Vaxart, Inc) tomorrow May 13 2019 at Open at Market. This is a penny stock – last close was $0.77 US.I have been experimenting with a bunch of software. This is the start of a new Trading Strategy for me, which I am working on.
Click on this link to visit stockcharts.com and view their stock chart of VXRT : http://schrts.co/NCSiIPYI
Disclaimer: This post is not meant as Investment Advice, nor is it advice to buy or sell any shares in any company.. Do your own Due Diligence. Seek out the advice of your own financial and investment advisors before risking any funds in the Stock or Futures Markets. You can lose money and even all of it when investing at the Stock Market Casinos. This post is for my own educational purposes.
Posted by: Vincent Banial
Order Fills AKS 10K at $2.49 ea and 1K of OOMA at $13.41 ea
Buy order filled for 10,000 AKS shares at $2.49 each.
Buy order filled for 1,000 OOMA shares at $13.41 ea.
Disclaimer: This post is not meant as Investment Advice, nor is it advice to buy or sell any shares in any company.. Do your own Due Diligence. Seek out the advice of your own financial and investment advisors before risking any funds in the Stock or Futures Markets. You can lose money and even all of it when investing at the Stock Market Casinos. This post is for my own educational purposes.
Posted by: Vincent Banial
Buying 10,000 shares of AKS (AK Steel Holding Corp) on NYSE at Open at Market on May 06
I will be buying 10,000 shares of AKS (AK Steel Holding Corp) on NYSE at Open at Market – all or none – on May 06.

Stock chart of AKS on NYSE. Chart created via AmiBroker
Disclaimer: This post is not meant as Investment Advice, nor is it advice to buy or sell any shares in any company.. Do your own Due Diligence. Seek out the advice of your own financial and investment advisors before risking any funds in the Stock or Futures Markets. You can lose money and even all of it when investing at the Stock Market Casinos. This post is for my own educational purposes.
Posted by: Vincent Banial
Buying 1,000 shares of OOMA on NYSE at Open at Market on May 06
I will be buying 1,000 shares of OOMA on NYSE at Open at Market – All or None on Monday May 06. Had initially considered buying 10,000 shares, but the trading volume is too low and so will only buy 1,000 shares.

OOMA stock chart on NYSE. Chart created via AmiBroker
Disclaimer: This post is not meant as Investment Advice, nor is it advice to buy or sell any shares in any company.. Do your own Due Diligence. Seek out the advice of your own financial and investment advisors before risking any funds in the Stock or Futures Markets. You can lose money and even all of it when investing at the Stock Market Casinos. This post is for my own educational purposes.
Posted by: Vincent Banial
Stock Trading Review for period ending May 03 2019
Sold 10,000 shares of NVDA NVidia Corp on NASDAQ at $182.38 per share. I had purchased those NVDA shares at $178.75 per share. Capital Gain on sale of NVDA = $182.38-$178.75 = $3.63 per share. 10,000 shares sold at $3.63 Capital Gain each = $36,300.00 realized Total Capital Gain. Continue reading
Just Sold 10,000 shares of NDA (NVidia Corp) on Nasdaq at $182.38 per share
Just Sold 10,000 shares of NVDA (NVidia Corp) on Nasdaq at $182.38 per share. Was posted to our Uniquely Toronto FB page at https://www.facebook.com/UniquelyToronto/
So I had bought 10K shares at $178.75 and sold them for $182.38. This resulted in a Capital Gain of $3.63 per share.
https://finance.yahoo.com/quote/NVDA?p=NVDA&.tsrc=fin-srch
Gross Capital Gain on the NVDA trade was $3.63 per share at 10,000 shares = $36,300.00. Not Great, but not bad for a few days work. The one Down Side is that because I flipped it, I will have to pay Income Tax on the full amount of the Capital Gain. Long Term Investors (in Canada) only pay Income tax on 50% of their Capital Gain..
Disclaimer: This post is not meant as Investment Advice, nor is it advice to buy or sell any shares in any company.. Do your own Due Diligence. Seek out the advice of your own financial and investment advisors before risking any funds in the Stock or Futures Markets. You can lose money and even all of it when investing at the Stock Market Casinos. This post is for my own educational purposes.
Posted by Vincent Banial
Sold 10,000 shares of NVDA on Nasdq at $182.38
Sold 10,000 shares of NVDA (NVidia Corp) on Nasdaq at $182.38. Was posted to our Uniquely Toronto Facebook page at https://www.facebook.com/UniquelyToronto/.
Disclaimer: This post is not meant as Investment Advice, nor is it advice to buy or sell any shares in any company.. Do your own Due Diligence. Seek out the advice of your own financial and investment advisors before risking any funds in the Stock or Futures Markets. You can lose money and even all of it when investing at the Stock Market Casinos. This post is for my own educational purposes.
Posted by Vincent Banial
Order filled for 10,000 shares of RIG on the NYSE at $7.60 per share
Buy order for 10,000 shares of RIG (Transocean Ltd) on the NYSE was filled at $7.60 per share.
Disclaimer: This post is not meant as Investment Advice, nor is it advice to buy or sell any shares in any company.. Do your own Due Diligence. Seek out the advice of your own financial and investment advisors before risking any funds in the Stock or Futures Markets. You can lose money and even all of it when investing at the Stock Market Casinos. This post is for my own educational purposes.
Posted by Vincent Banial
Buying 10,000 shares of RIG (Transocean Ltd) on NYSE on May 03 at Open at Market
A new Technical Trade. I’m stepping back from the Morning Gap trades and going beack to Technical Trades. Tomorrow I will buy 10,000 shares of RIG (Transocean Ltd) on the NYSE at Open at Market on May 03. All my trades are “all or none”.
I don’t think a Million share buy would get filled. also if the stock price is cheap – ie under say $10 per share then I’m sticking to either buys of 1,000 or 10,000 shares. Large volume buys help grow capital Gains but are frustrating because they it is hard to get filled. Then if I want to dump, it could backfire on me as getting fills could be an issue. 1 K or 10K should be fine.

Stock chart of RIG (Transocean Ltd) on NYSE. Chart courtesy of www.tradingview.com Buy was triggered by CCI and Woodies CCI and confirmed by RSI. On Aug 21 2017 the stock bottomed at this same level. Normally the price has been above the current price range. Hence I am of the opinion that the price has again bottomed and it is time to buy. This is longer term hold (might be a swing trade or longer – it is not quick flip type of trade).
Disclaimer: This post is not meant as Investment Advice, nor is it advice to buy or sell any shares in any company.. Do your own Due Diligence. Seek out the advice of your own financial and investment advisors before risking any funds in the Stock or Futures Markets. You can lose money and even all of it when investing at the Stock Market Casinos. This post is for my own educational purposes.
\
Posted by: Vincent Banial
Buy order filled – 10,000 Shares of ECA Encana Corp on NYSE at $6.44 ea
Order filled at 9.31am on NYSE. Bought 10,000 shares of ECA Enacna Corp today at $6,44 per share.
Posted by: Vincent Banial
Buying 10,000 shares of ECA (Encana Corp) on the NYSE tomorrow May 02 at Open at Market
Another Technical trade, based on CCI and confirmed by RSI. Because the price of this stock is under $10, I cannot buy 1 Million Shares. Even an order for 100,000 shares would have some issues. 10K should get filled quickly and easily. I believe that I am a bit early on the buy, as Friday morning might confirm what I expect will happen. I had waited too long to get into the PINS IPO as I did not expect the share price keep rising day after day without any consolidation (at least not till I bought in).
Buying 10,000 shares of ECA (Encana Corp) trading on the NYSE at Open on May 02 at Market.
https://stockcharts.com/freecharts/gallery.html?ECA
My Target to sell will be around $8.35 as Resistance is around $8.50. The Gap Down which was created Nov 01 2018 could get filled and the price could float higher around $10 before taking a longer rest.
Disclaimer: This post is not meant as Investment Advice. Do your own Due Diligence. Seek out the advice of your own financial and Investment Advisors before risking any funds in the Stock or Futures Markets. You can lose money and possibly all of it. This post is for my own educational purposes.
Posted By Vincent Banial
Order Fills
TWTR – 1,000,000 shares at $39.30 per share – filled
AAN – 1,000 shares at $58.00 per share – filled
MTP – 1,000,000 shares at $3.60 per share – filled
PINS – 1,000,000 shares at $34.81 per share – filled
NVDA – 10,000 shares at $178.75 per share – filled
MTP is a foreign BioTech – an ADR – long term this should work out. Short Term loser – went below $2.00 today. Will hold for long term.
Interesting the difference between low price and high priced share performance coming off a Breakout Gap (except PINS which is a IPO and NVDA which was based on the CCI and Woddies CCI).
Disclaimer: This post is not meant as Investment Advice, nor is it advice to buy or sell any shares in any company. Do your own Due Diligence. Seek out the advice of your own financial and investment advisors before risking any funds in the Stock or Futures Markets. You can lose money and even all of it when investing at the Stock Market Casinos. This post is for my own educational purposes.
Posted by Vincent Banial
Buying 10,000 shares of AIRI ( Air Industries Group) on AMEX at market Open Apr 30
Buying 10,000 shares of AIRI ( Air Industries Group) on AMEX today (Apr 30) at Market Open with an at Market Buy order. I would love to be able to buy more shares but the trading voume would probably not allow it. This company is apparently into Aerospace/Defense Products & Services
Why?
Stock is starting to form a “W”. IMHO a “W” formation points to a “WINNER”.

Stock chart of AIRI trading on AMEX. Chart courtesy of www.tradingview.com
Disclaimer: This post is not meant as Investment Advice, nor is it advice to buy or sell any shares in any company.. Do your own Due Diligence. Seek out the advice of your own financial and investment advisors before risking any funds in the Stock or Futures Markets. You can lose money and even all of it when investing at the Stock Market Casinos. This post is for my own educational purposes.
Posted by Vincent Banial
Buying 10,000 shares of NVDA (NVidia Corp) on Nasdaq at Open at Market on Apr 30
NVidia sells well respected High Performance Video Cards for Personal Computers. They are also involved in super high performance computer centers (Super Computers) and also Cloud Gaming Servers.
This will be a Technical Buy based on the CCI and Woodies CCI. Have placed a Market Order to buy 10,000 shares of NVDA (NVidia Corp) on Nasdaq at Official Market Open on Apr 30. I do not do off hours trading. Wish I could afford to buy 1 Million shares of NVDA

NVDA – NVidia Corp on Nasdaq. Chart courtesy of www.tradingview.com
Resistance between $185 and $190. Target to sell at $205 once the initial Resistance is broken. This will be a short Term Swing Trade of roughly about a month.
Disclaimer: This post is not meant as Investment Advice, nor is it advice to buy or sell any shares in any company.. Do your own Due Diligence. Seek out the advice of your own financial and investment advisors before risking any funds in the Stock or Futures Markets. You can lose money and even all of it when investing at the Stock Market Casinos. This post is for my own educational purposes.
Posted by Vincent Banial
