
Tagged: Bed Bath & Beyond Inc
Looks like Bed Bath & Beyond Inc stock price (BBBY) is breaking out
I was checking the QQQ Stock chart on Finviz and noticed that the chart of BBBY looks to me like it is breaking out.
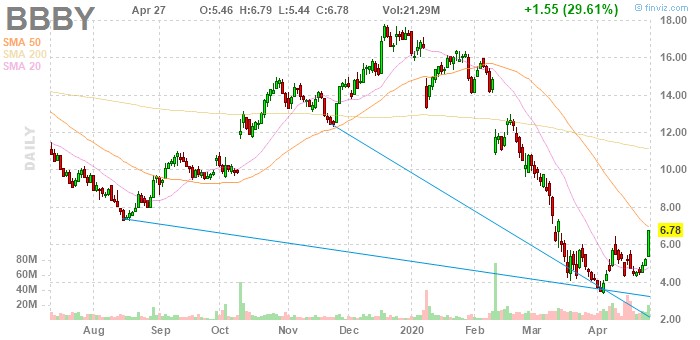
In my opinion the first target could be $10 which is just under the 200 day MA. Back when I traded equities, I would Swing Trade and not buy and hold. The chart also looks to me like it formed a “W” shaped bottom. Price hit bottom below $4 and moved up. Then the price corrected back down. Now this leg back up also went higher than the prior high set back in April.
This post is not meant as investment advice. Please seek out the help and advice of your own Investment Advisor. You can lose money, even all of it, when placing bets at the Stock & Options Market Casinos. Posted for my own education. I’m trying to learn ways to trade the QQQ Options and happened to notice the stock chart of BBBY.
Posted by Vincent Banial
