
GuestLogix Inc. Breakout. Trading on the Toronto TMX exchange, as symbol GXI
GuestLogix Stock Chart – Shorter Term View – symbol GXI trading on stock exchange in Toronto. Price Breakout on Mar 11
Time for another Trading / Investing related post. It’s been a while since the prior post about trading Ford shares. Two stock charts were added to this post. Both are daily charts. One shows a longer term view and the other short-term view. Both also have Fibonacci ratios plotted on them.
The move on Monday Mar 11 2013 was strong. GXI barreled above of it’s prior High of $1.11 which was made Jan 17 2013. This type of chart action is called a breakout. When such a move, above a prior high, is made on decent volume then that breakout becomes more trustworthy. Breakouts on low volume could be a false breakout. Traders just shaking the trees.
Lets assume that the GXI.TO breakout will continue upwards in price. The Fibonacci levels can give one an idea where there could be resistance to further increases in price. The 50% level ($1.15) is key. Once that is broken then GXI could go to the 61.8% level ($1.34). If that level is broken then the price could head to $1.62. Bear in mind that Fibonacci levels are not always precise to the penny.

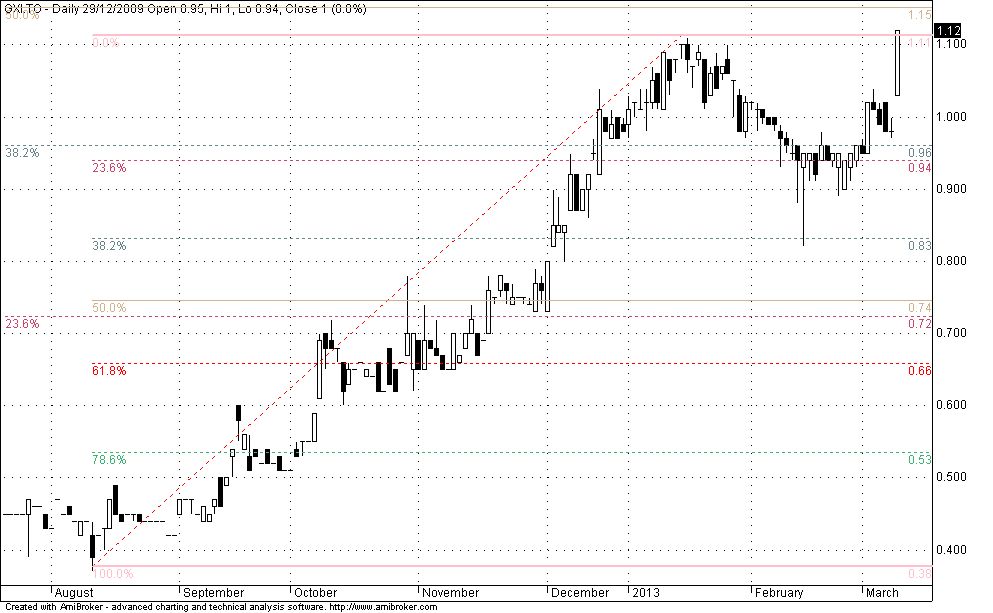
GuestLogix Stock Chart – Longer Term View – symbol GXI trading on stock exchange in Toronto. Price Breakout on Mar 11
From that high made on Jan 17 2013 the price corrected back down by 38.2%, an important Fibonacci level. It went a touch below that and then reversed. That is a good example of a Fibonacci level, serving a potential reversal point.
Most Technical Analysis Stock Charting Software allow you to plot Fibonacci retracement lines. This post is here for two reasons. First reason is to highlight what a Price Breakout looks like. The second is to show how Fibonacci Ratios can and in my opinion do affect stock price movements. You mileage may differ. Different people use different tools, when analyzing stocks.
My prior post on trading FORD shares, used only the stock price. No TA indicators. Not even a volume plot. This study of GXI price action is much the same. Only Fibonacci lines were added, to the simple stock chart.
I could easily plot a ton of indicators and oscillators. Easy to waste lots of time. It’s also easy to even get a touch of analysis paralysis, if your brain is given too much information. Keep things simple, is my motto.
Why such a sudden move up, in the share price of GXI? Who knows. My unsubstantiated opinion is that possibly word has gotten out that the next company report might exceed expectations. Or maybe they have signed some big contract. I only follow the Price action, as shown on the Price Chart. I do not care about why prices go up. That they break above a prior high, is what gets my interest. Fundamentals and reports and contracts, I leave to others far more knowledgeable than I.

English: Contemporary portrait of Fibonacci by unknown medieval artist. (Photo credit: Wikipedia)
It might be worth your while to do some research on Fibonacci ratios and stock price movement. Your local library may have some interesting books on Stock Investing Trading. The Toronto Library has always been a great resource to check, beyond my own home library.
Much like cameras and camera bags, I just can’t seem to have enough books on Trading and Investing. Always a desire to buy and read more…
DISCLOSURE: I own shares of this specific stock.
Posted by: Vincent Banial
Disclaimer: This post is not meant as Financial or Investment advise. Do your own Due Diligence. Always seek out the help and advise from your own Financial and Investment Professionals. I am not, nor ever have been a registered Financial or Investment Advisor. You can lose money, even all of it, when placing bets at the Financial Markets Casinos. This post is for entertainment purposes.
